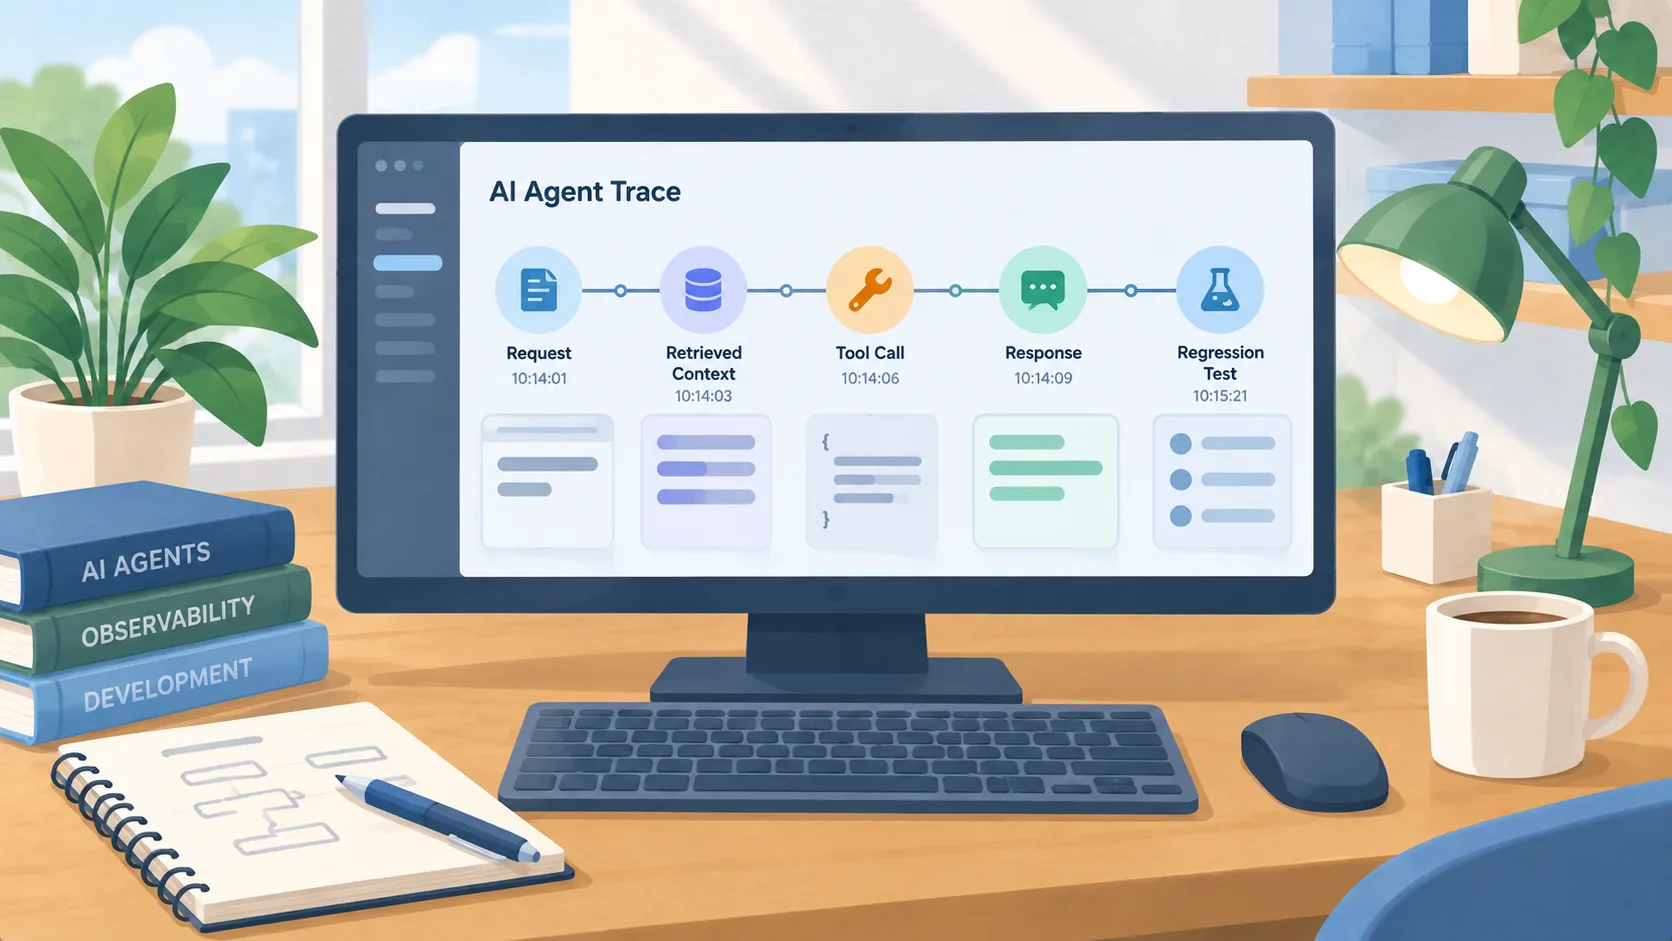
The useful part is the sequence
GitHub’s September 22 release says administrators can configure OpenTelemetry for the Copilot app through enterprise-managed settings. The traces can show a session’s model requests and tool use, and the release says prompt and response content is excluded by default. That gives teams another way to inspect agent execution in the monitoring tools they already use.
That is a visibility feature, not a correctness guarantee. A trace can show what ran, where a request slowed down, or which tool returned an error. It cannot decide whether the answer was right for the customer or whether a change was acceptable. Treat it as evidence for investigation, then connect the evidence to an outcome the team can check.
Start with one failure question
Before enabling telemetry across a team, name the question it should answer. For example: when a draft misses a required field, can the operator tell whether the source was absent, the model skipped it, or the downstream tool rejected it? If no one can name a question, a flood of spans becomes another system to maintain.
Choose a narrow workflow and define the event sequence that matters: request received, records retrieved, decision made, tool invoked, response returned, human accepted or corrected. Keep each event tied to a stable workflow identifier, not a person’s name or sensitive document contents. This makes traces useful for troubleshooting while limiting the data you collect.
Decide what the trace may contain
Prompt and response exclusion by default is a useful boundary, but teams still need to inspect the final configuration and the destination. Decide who can read traces, how long they are retained, whether exports include sensitive identifiers, and what the support process does when a user reports an issue. A trace endpoint should be governed like other operational logs.
Test the exact view with synthetic or redacted examples before expanding access. Confirm that the collector receives the fields you intended, that content is not captured unexpectedly, and that a reader can connect an event to a workflow without seeing unnecessary customer data. Record the owner who can change the settings and the reviewer who approves any expanded capture.
Turn the trace into a regression check
A resolved incident should leave behind a test case whenever the workflow can be reproduced safely. Save the input shape, relevant tool responses, expected decision, and the condition that failed. Remove private values, preserve the interaction pattern, and run the case when prompts, models, tools, or permissions change.
Not every trace can become a deterministic test. Some outcomes need a reviewer or a rubric. That is still better than relying on memory: record the issue category, the evidence a reviewer should inspect, and the threshold that should stop a release. The aim is to keep the next change from reopening a known failure, not to claim every run is predictable.
A practical rollout
Pilot tracing with one owner and one recurring failure mode. Have an operator report a miss, inspect its trace, write down the cause, and decide whether to change the workflow or the test. Then review what the trace revealed and what it exposed. If the team cannot use the data to make a decision, narrow the collection or improve the event labels before scaling it.
For a team comparing monitoring options, also ask how trace access follows existing roles, how redaction works, and whether a trace can be exported into the incident record. Keep the scope modest until someone can demonstrate the complete loop from report to evidence to fix to regression check. That is a stronger readiness test than simply confirming that an observability dashboard loads.